Persona · Custom Product Pages / Listing experimentation
Chapter 1 of 7 · Microsoft Store Discoverability
WHOSE PAIN
Meet Priya, the Plateaued.
Established indie. FocusDrop Timer shipped 3 years ago. 50,000 installs. Growth flatlined for 6 months. Two doors are closed on her: she can't iterate on her listing without shipping a new build, and she can't see why she's ranked #19 for "focus timer" when her title contains the exact term.
3yr live on Store
50K installs
Growth flat 6 mo
4.4★ · 312 reviews
Ranked #19 for "focus timer" (exact-match in title)
4 sub-3★ apps ranked above her
Priya · mid-stage indie dev · solo PM + dev
feeling: stuck on two doors — can't iterate, can't see why she's being buried
Priya's iteration backlog · this week
Mon
Swap lead screenshot — current one is 3 years old, taken on old Surface.
Tue
Test a sharper tagline: "Focus on what matters" vs current "A simple timer for deep work".
Wed
Try a variant aimed at students for searches like "pomodoro" / "study timer".
Thu
Try a variant aimed at remote workers for "deep work" / "calendar block".
Fri
Figure out why I rank #19 for "focus timer" when my title contains the exact term.
Fri
See which variant won — keep the winner, learn from the loser.
Reality
Microsoft Store gives her one Product Page Experiment slot at a time, only lets her vary the logo and screenshots, and shows her no diagnostic on why she's ranked where she's ranked.
THE PAIN · TWO PILLARS
Two doors. Both closed.
Pillar 1 · I can't iterate.
"I tried to do some A/B testing, but I don't know, that didn't give me good results, so I stopped doing that."
— Dave Smits, established Microsoft Store dev · VoD Pulse, 4 June 2026
1 active experiment per app
Vary logo + screenshots only
90-day max duration
No targeting
Pillar 2 · I can't see why I'm stuck.
Established devs with strong quality signals are routinely out-ranked by newer or lower-quality apps — with no diagnostic for why. Surfaced in Ongoing Customer Issues across May–Jun 2026.
Title-match ignored
Sub-3★ apps above 4★+ apps
Engagement quality not rewarded
Per-market behaviour opaque
Pillar 1 · Iteration evidence
VOD PULSE · Sep 2025
"The A/B testing in Partner Center is too limited. One variant, fixed split, and you wait three months for a result you can't trust."
Productivity app dev · VoD Pulse Q3'25 free-text
REDDIT · r/microsoftdevs
"Why can I change my logo OR my screenshots in an experiment but not both? I want to test a whole new positioning."
"My app has 44 reviews and a 4.9-star rating, yet it's ranked around 100, with countless 0 review and completely unrelated apps ahead of it."
Tipa · publisher of WorkingHours, GeoPhoto
WHY SHE STOPPED
The PPE box has four walls.
Microsoft Store does ship a listing-experimentation feature — Product Page Experiments (PPE). It's not absent. It's just structurally too narrow to test the hypotheses Priya actually has.
Here's what PPE lets her change — and everything it doesn't:
Wall 1 · Variants
1 active
Apple CPP: up to 35 · Google CSL: up to 50
Wall 2 · What you can vary
Logo + screenshots only
Not tagline. Not description. Not keywords. Not category. Not "What's new". Apple & Google let you vary every asset including text.
Wall 3 · Targeting
One global audience
No country, language, keyword, device, or install-state targeting. Same variant served to every user worldwide.
Wall 4 · Duration
90 days max
Then it auto-stops, winner-or-not. Cert required to start the next one.
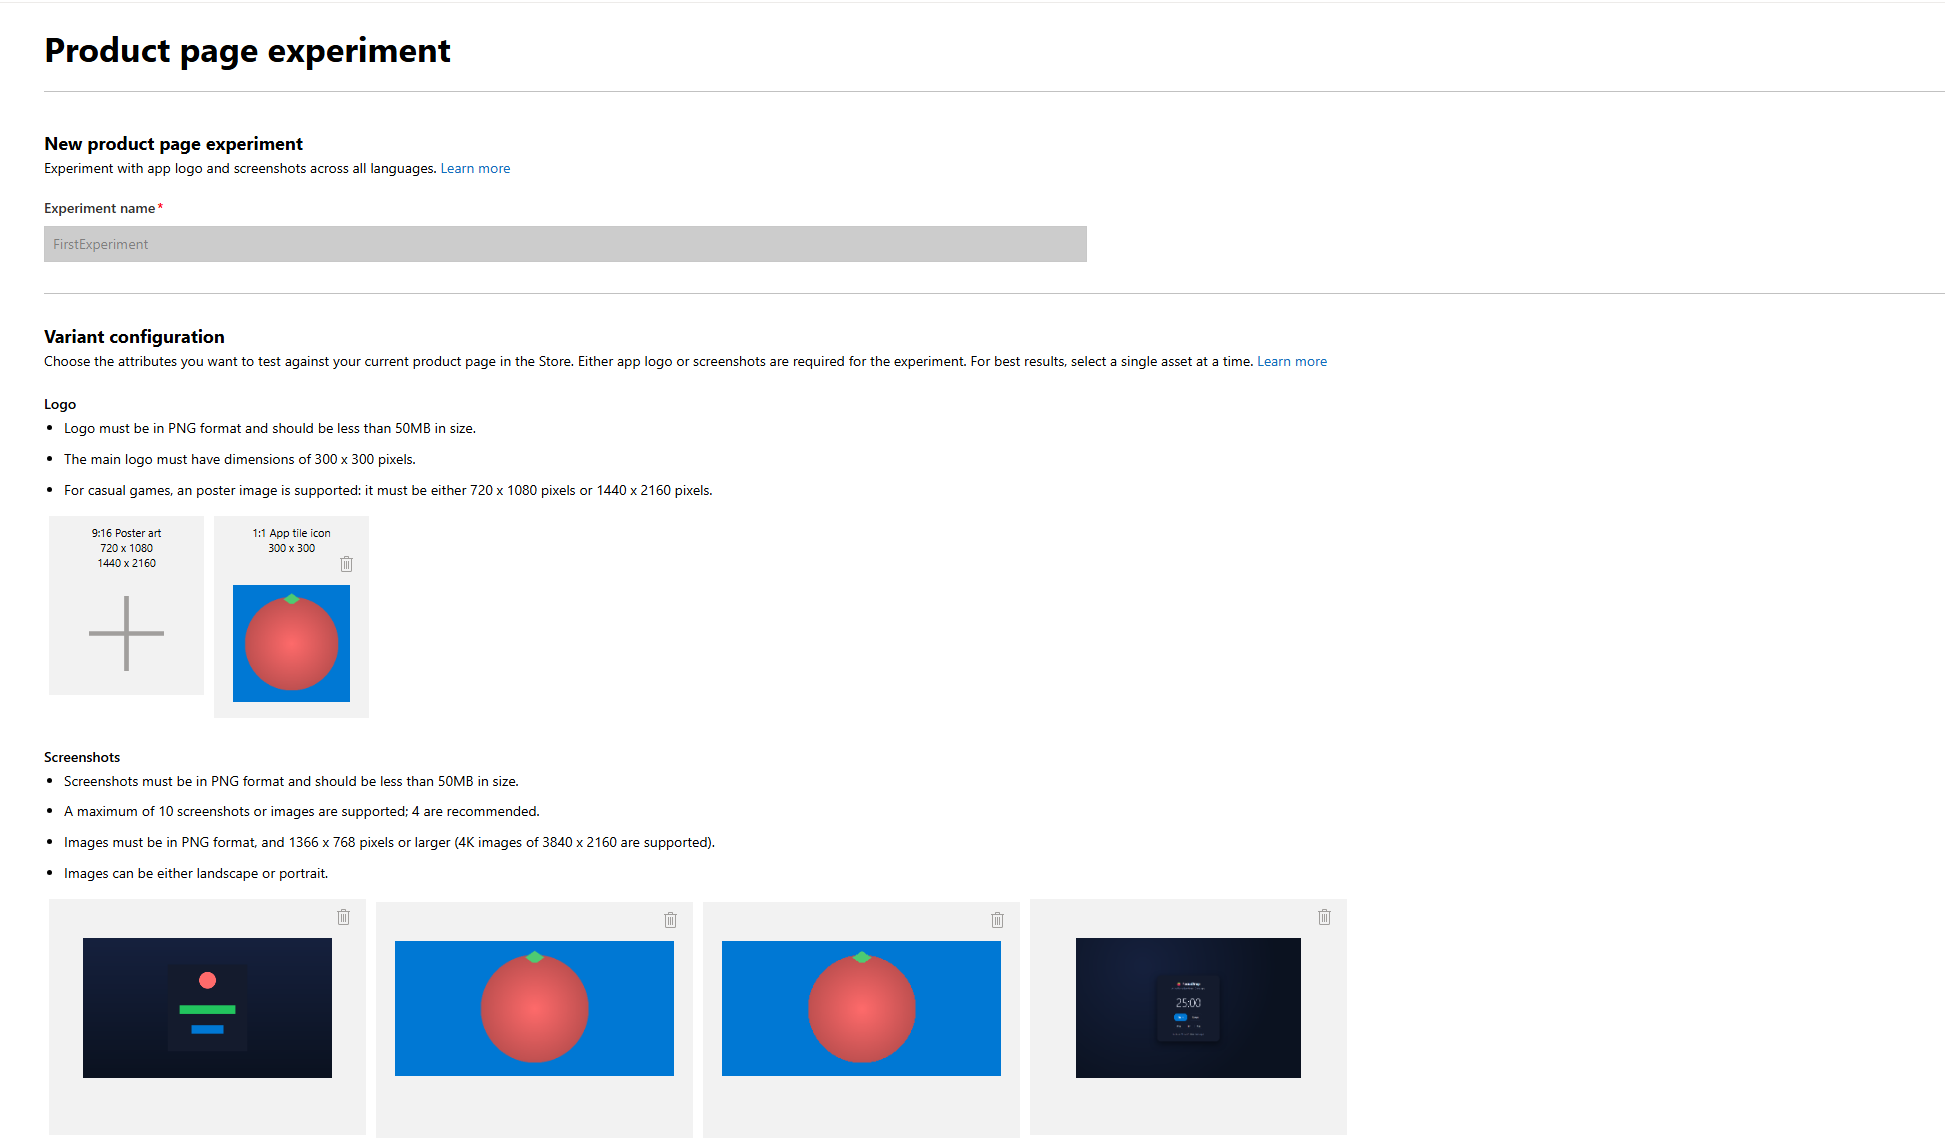
Microsoft Partner Center · New Product Page ExperimentThe whole variant configuration surface — June 2026
What this screen does NOT have
No tagline field. No description field. No keyword field. No category override. No "What's new" override. No country / language / keyword targeting. No traffic-split control. The whole experiment surface is two image upload boxes.
APPLE SHIPS IT. GOOGLE SHIPS IT.
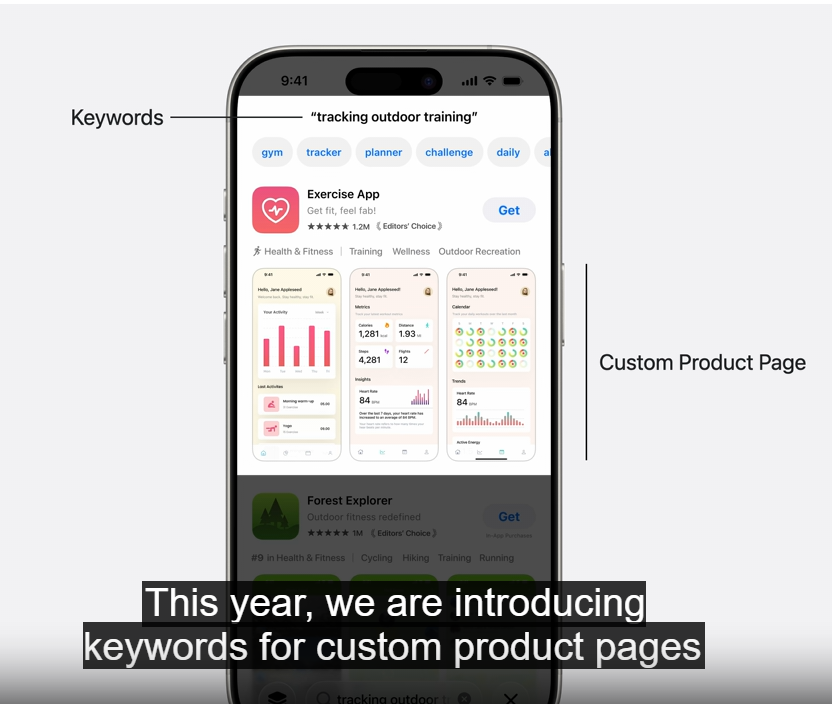
Apple ships a page per keyword. Google ships 181 countries of peer-benchmarked data. We ship two image upload boxes.
When a user searches "tracking outdoor training", Apple surfaces a Custom Product Page whose screenshots match. 35 CPPs per app, each bindable to a specific search keyword.
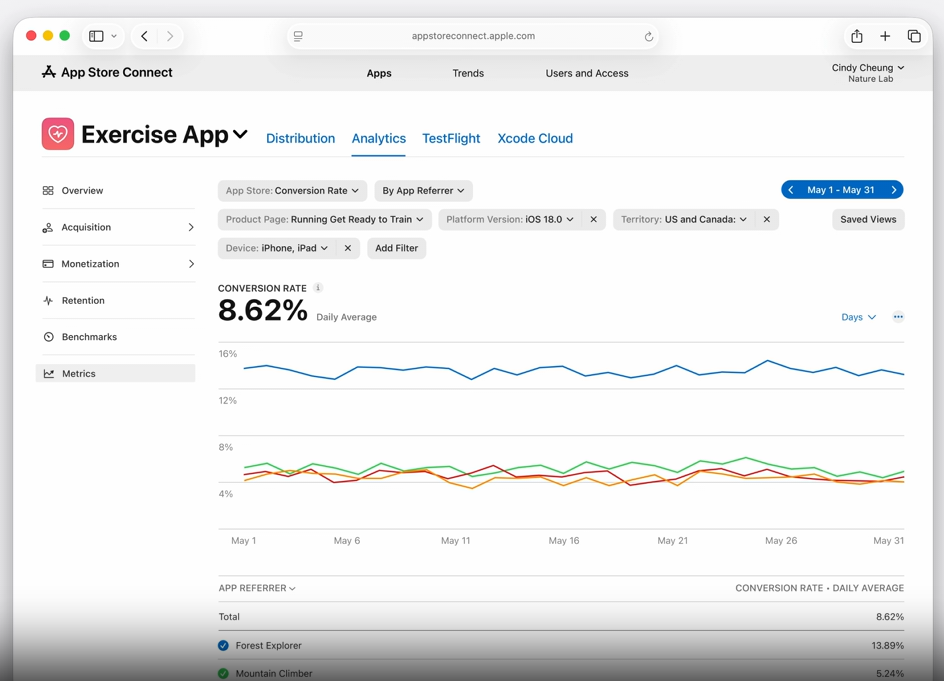
Conversion for one CPP: 13.89% via "Forest Explorer" referrer, 5.24% via "Mountain Climber" — aggregating to 8.62%. Broken by Referrer × Product Page × Platform × Territory × Device.
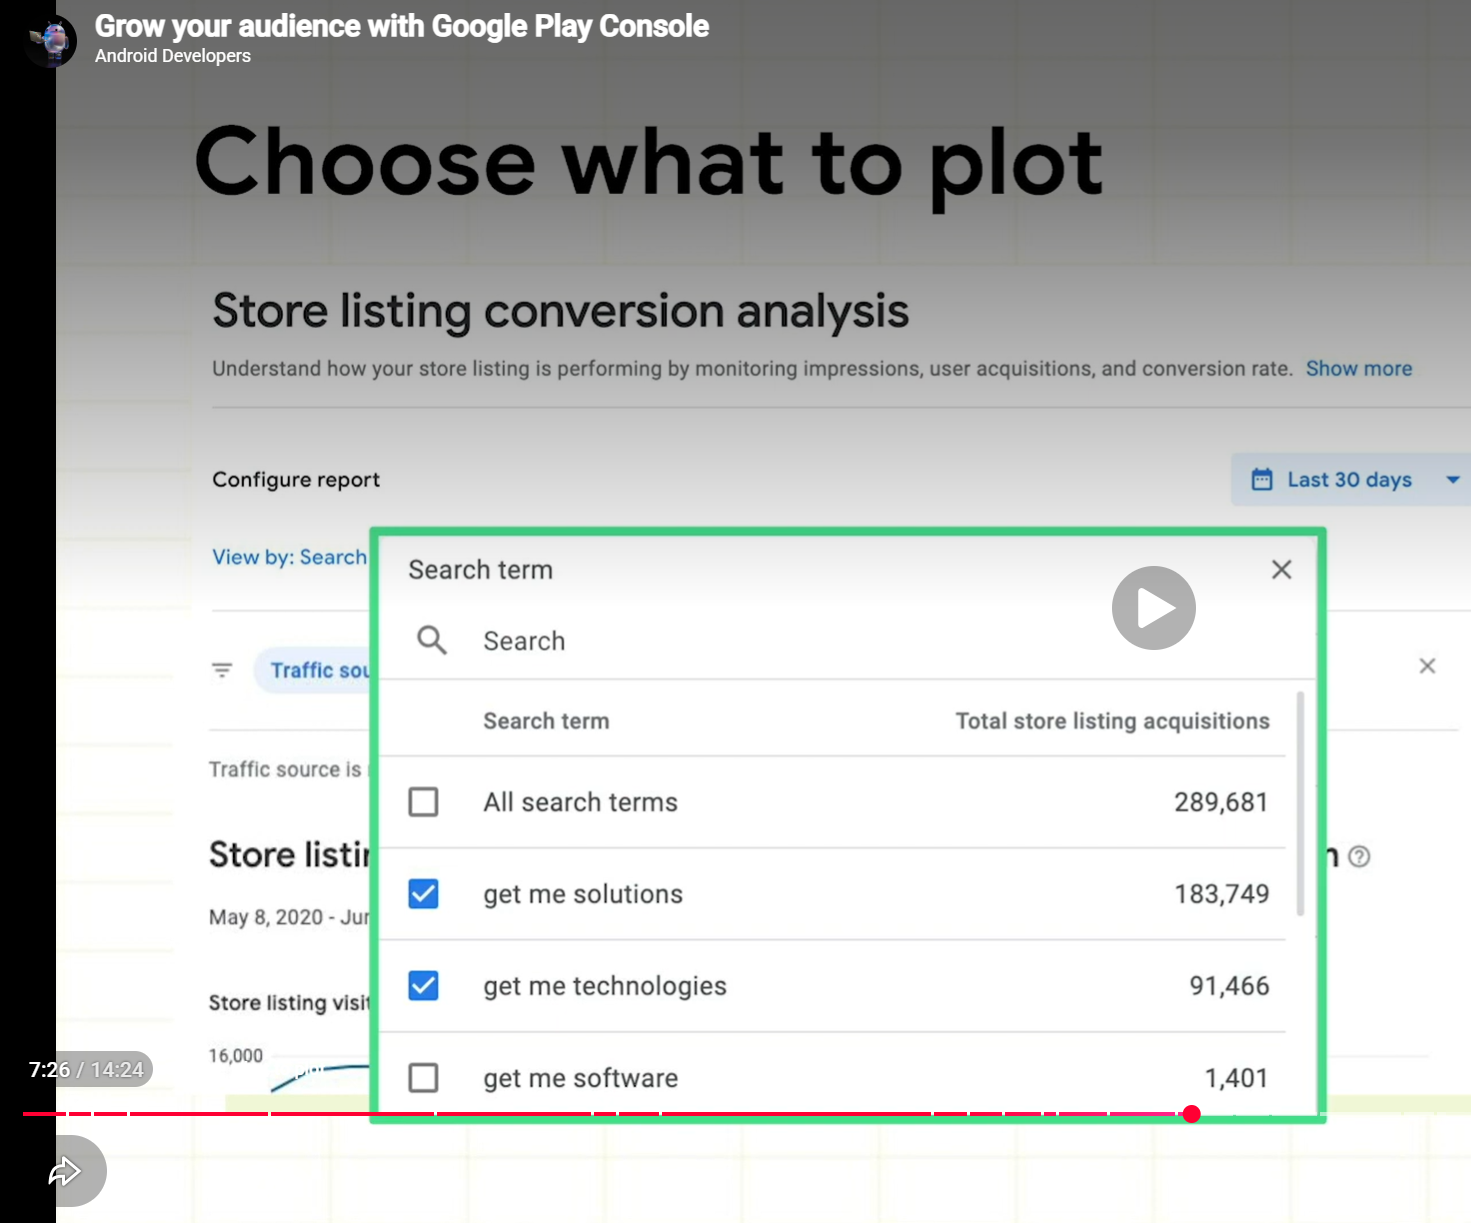
play.google.com/console · Store listing · Search-term acquisitions
Acquisitions broken by exact search term.
A real Android dev sees "get me solutions" 183,749 installs, "get me technologies" 91,466, "get me software" 1,401 — pulled from Google Play search. Tells her which queries to optimise her listing for.
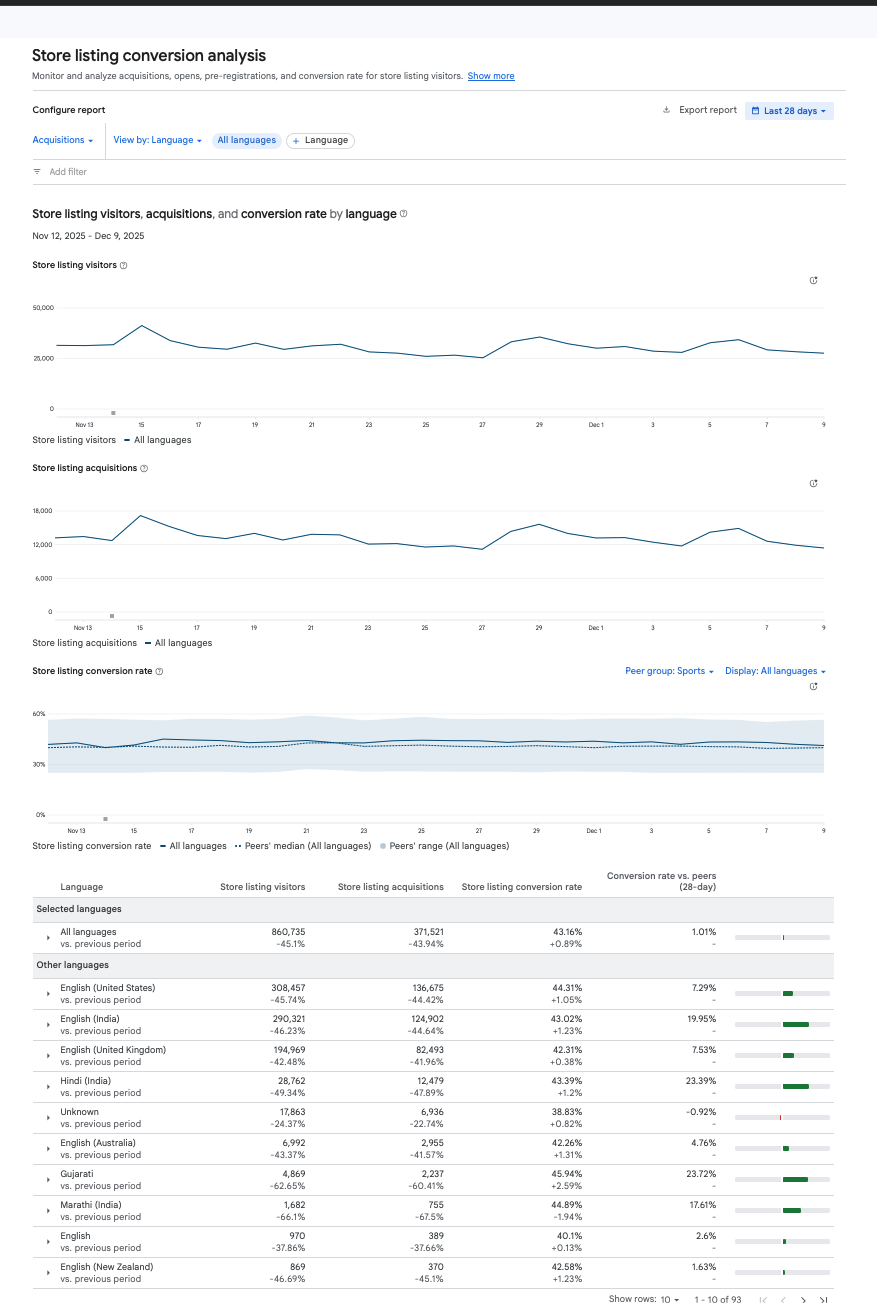
play.google.com/console · Conversion analysis · By language
CR vs peer median for every language she ships in.
English-US 44.31%, Hindi 43.39%, Gujarati 45.94% (+23.72% vs Sports peer median). 93 languages, each with a green/red delta against the category benchmark.
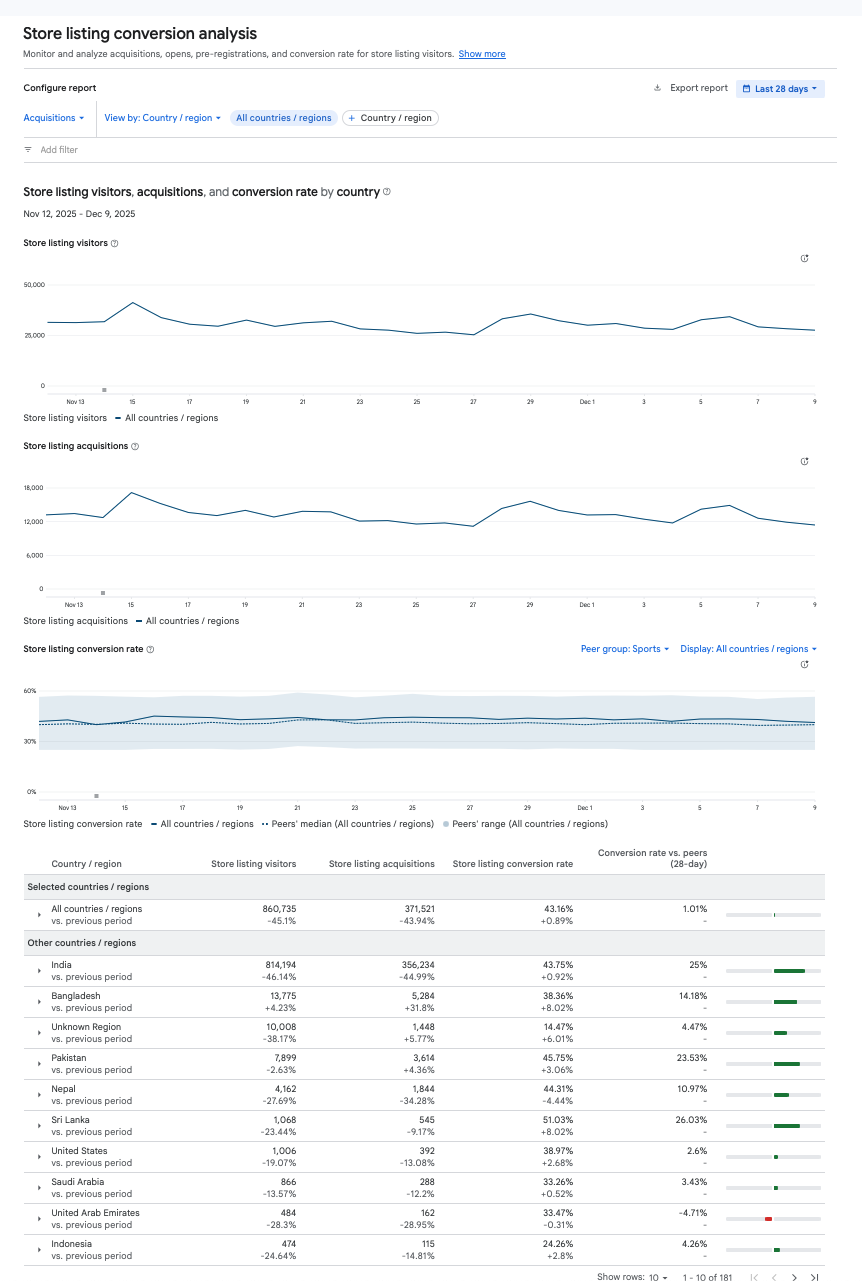
play.google.com/console · Conversion analysis · By country
CR vs peer median, across every country she's live in.
India 43.75% (+25% vs peers), Pakistan 45.75% (+23.5%), UAE 33.47% (−4.71% vs peers, red). 181 countries, each with a benchmark — tells her where to invest in localised listings.
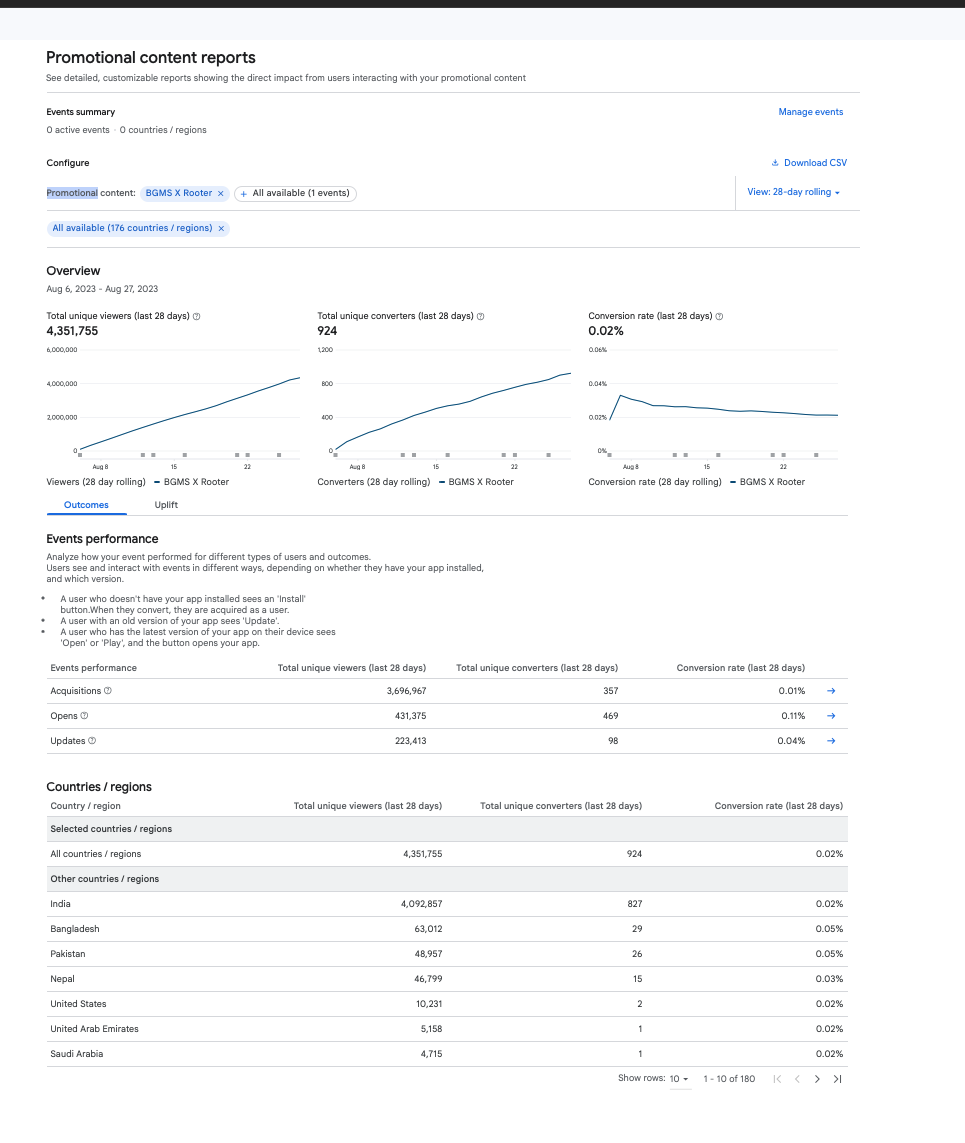
"BGMS X Rooter" promotional event: 4.35M viewers, 924 converters, broken by Acquisitions / Opens / Updates × 176 countries, rolling 28-day window. Microsoft Store has no concept of a promotional event tied to listing analytics.
partner.microsoft.com/dashboard · Product page experiment · New
Logo + screenshots. One global audience.
1 active experiment per app. The variant configuration surface is two image upload boxes — no tagline, no description, no keywords, no category, no "What's new" override. No country, language, keyword, device, or install-state targeting. Cert required to start the next one.
Apple App Store
35
listing variants per app + 3 live A/B treatments
Google Play
50
custom store listings per app (100 for partner accounts)
Microsoft Store
1
product page experiment at any one time
Targeting — who sees the variant
Bind variant to search keyword
✓
✓
✗
Target by country / language
✓
✓
✗
Vary text (tagline, description, keywords)
✓
✓
✗
Analytics — what she learns from it
CR broken by referrer × device × territory
✓
◐
✗
Revenue / proceeds per variant
✓
◐
✗
Per-country / per-language CR vs peer median
✗
✓
✗
Cohort retention (D1–D60) per variant
✓
✓
✗
Friction — how easily she can iterate
No re-cert needed to start a variant
✓
✓
✗
LLM tags / AI review summary on page
✓
◐
✗
IF WE GAVE PRIYA THIS TOMORROW
Three moves. No new code in her app.
Move 1 Decouple
Listing edits ship in hours.
Text, screenshots, tagline, "What's new" → review-only path, not full binary re-cert. Apple & Google did this years ago.
CR by referrer × country × device × keyword. Per-language CR vs peer median. Cohort retention per variant.
Roadmap · what ships when
P0 · NOW
Restore trust.
Audit & fix PPE data-layer bugs surfaced in dev tickets.
P1 · 1Q
Listing ≠ binary.
Text, screenshots, tagline → review-only path. Vary all assets together in PPE.
P2 · 2Q
Reach Google parity.
10+ variants. Country & language targeting. Per-variant breakdown analytics.
P3 · 3Q
Reach Apple bar.
Per-keyword variants. Peer-group CR benchmarks. AI-assisted tag & review summaries.
END-GOAL · DISCOVERY MET
Both doors open. A healthier Store.
Pillar 1 (iteration) gets unblocked by the listing-experimentation work; Pillar 2 (visibility) gets unblocked by the Ranking & Visibility prototype. Outcomes for both:
+32%
CR uplift · MobileAction case study, CPP on a games portfolio
+15%
Install uplift · Koo, Google Play CSL targeted by language
FiltersLast 30 days ▾Market: United States ▾All sources ▾All devices ▾App version: any ▾Reset
Overview
Search visibility
View details
Tracked keywords (your watchlist) where you rank in top 10
2 / 7
You rank top-10 for pomodoro and study timer; the other 5 are outside top 20.
Per-keyword breakdown (last 30 days, US):
pomodoro — #4
study timer — #7
focus timer — #19
deep work — #22
productivity timer — #28
kitchen timer — #67
alarm clock — #88
Top-10 is the visibility threshold for organic Store search — impressions drop off sharply below it. Click "Diagnose" in the keyword table below to see the per-signal breakdown for each keyword.
Sessions per user
View details
How often each installed user opens your app, vs your keyword peers
Top 14%
The average person who installs FocusDrop uses it more often than 86% of apps that compete with you for your tracked keywords (peer set built per-keyword, not category-wide).
Why it matters: this is a quality-of-fit signal. If lots of people install but few open the app again, your listing is over-promising and your problem is fit. If a small audience installs but each opens often, your listing is under-discovered and your problem is acquisition. Yours is the second. Strong per-user engagement + low install volume = a rank/visibility problem, not a product problem.
Your numbers: 5,420 sessions in the last 30 days ÷ 1,840 active installs = 2.95 sessions per user. Keyword-peer median for your tracked terms: 1.71.
30-day rank movement
View details
Net rank change across your 7 tracked keywords vs prior 30 days
↑ 1 rising→ 4 flat↓ 2 falling
1 rising · 4 flat · 2 falling.
Per-keyword movement (last 30 days vs prior):
study timer — #7 (was #9) · ↑ +2
pomodoro — #4 (was #4) · flat
focus timer — #19 (was #19) · flat
deep work — #22 (was #22) · flat
productivity timer — #28 (was #27) · flat
kitchen timer — #67 (was #61) · ↓ −6
alarm clock — #88 (was #82) · ↓ −6
Why it matters:5 of your 7 tracked keywords are flat or falling — algorithm has stopped rewarding your listing as-is. Your last listing change was 42 days ago.
Next steps: the 2 falling keywords (kitchen timer, alarm clock) are also your lowest-ranked — consider dropping them from your title and focusing your keyword spend on study timer (rising) and pomodoro (your strongest). Run a PPE experiment on the new listing.
All charts
Rank over time — tracked keywords
Your watchlist — seeded from your submitted keywords, expanded with search terms you tracked from the table below, plus anything you add manually.
For every result-set served on these terms users typed, what fraction of impressions did you capture? This is your reach, not your rank.
pomodoro
34%
48%
18%
34%
study timer
21%
62%
17%
21%
focus timer
8%
71%
21%
8%
deep work
6%
68%
26%
6%
productivity timer
4%
54%
42%
4%
kitchen timer
73%
26%
<1%
YouTop 3 peers (combined)Long tail (all other peers)
Rank tells you your position. Share of voice tells you your reach. The two don't move at the same speed. Moving from #19 to #8 on "focus timer" would roughly triple how many people see you, because most people scroll to #8 but few scroll past #15. Moving 10 spots on a low-volume term like "kitchen timer" barely changes anything. That's why fixing your top keywords matters more than fixing the bottom ones.
Listing health
Computed from your existing Partner Center listing data, benchmarked against anonymized medians for the apps that compete with you on your tracked keywords (per-keyword peer set, not category-wide). Every issue below maps to a real Partner Center field.
73
Listing health
Keyword-peer median: 81 Keyword-peer top quartile: 92+
✓
Subtitle present in primary locale (en-US)
!
Subtitle missing in 4 of your 12 supported locales· DE, FR, JP, KR · keyword-peer median: 11 / 12 localized
Funnel for users who searched "focus timer" in the United States, last 30 days.
Impressions
1,250
You showed up in 1,250 result lists
Page views
28
2.2% clicked through (peer median 4.6%)
Installs
4
14.3% installed after viewing (peer median 11.0%)
End-to-end: 4 installs from 1,250 impressions = 0.32% overall install rate. Peer median for this term: 0.51%.
Top 5 results above you for this term
Rank
Product
Rating
Installs 6M (bucket)
Their CR (impression→install)
#1
App at rank #1
4.7★
10K+
0.78%
#2
App at rank #2
4.6★
5K–10K
0.62%
#3
App at rank #3
4.5★
5K–10K
0.54%
#15
App at rank #15 (sub-floor)
2.4★
10K+
0.41%
#17
App at rank #17 (sub-floor)
2.9★
5K–10K
0.38%
#19
★ FocusDrop Timer (you)
4.4★
1K–5K
0.32%
Where the gap is: Your click-through rate (2.2%) is roughly half the keyword-peer median — users see you in results but don't click. Once they do click, your install rate (14.3%) is actually above peer median. So the bottleneck is getting people to click on your card, not what happens after.
"deep work": 880 impressions → 12 page views (1.4%, below peer median 4.6%) → 1 install. Term not in your title; appears once in your long description.
"productivity timer": 620 impressions → 8 page views (1.3%) → 0 installs. Partial title match — the words appear separately, not together.
Where your installs come from
Microsoft Store search
48%
Microsoft Store browse
22%
Web referrer (apps.microsoft.com)
18%
Direct link / deep link
12%
Almost half of your installs (48%) come from people searching the Microsoft Store and finding you in the results. The rest comes from people browsing categories, clicking a web link, or being sent your app's direct link. Because search is your biggest channel, your rank for important keywords directly costs you installs when it's low.
Search terms driving installs
All search terms users typed that led to your product page in the last 30 days — including terms you don't actively track. The "In tracked list?" column shows whether a term is already in your 7 watched keywords (which feed the rank-over-time chart and the keyword diagnostics above). For new terms, click + Add to start tracking them — they'll show up in your future rank reports and Diagnose actions.
3 terms worth adding to your tracked list (highlighted): tomato timer, 25 minute timer, concentration timer. All convert above 0.55% (your tracked average is 0.27%) and you already rank in their top 15 without explicitly tagging for them. Adding them lets you watch their rank movement and run Diagnose on them.
Conversion rate vs peer apps (per-keyword peer set)
Benchmark built from apps that compete with you on the selected tracked keyword — not a flat category average. Switch keyword to see a different peer set.
Country
Impressions
Your CR
Peer median
Peer top quartile
Position
United States
15,420
4.8%
3.4%
5.9%
Above median
India
8,210
5.2%
3.6%
6.1%
Above median
Brazil
2,840
3.8%
2.9%
5.0%
Above median
Germany
1,640
2.1%
3.0%
5.2%
Below median
France
1,220
2.0%
2.8%
4.7%
Below median
Japan
980
1.4%
3.2%
5.4%
Bottom quartile
You convert above the Productivity median in your top 3 markets and below in DE/FR/JP. Those 3 markets account for 12% of your impressions but only 4% of your installs — localizing description and screenshots in those languages is the single biggest CR lever in this report.
Insights | Product page experiments Apps and games
Download Share Notifications
June 5–9, 2026 ▾
Product page experiments today let you vary only logo and screenshots. This prototype expands the surface to vary text and to target variants by tracked keyword. Send feedback
FocusDrop Timer
FirstExperiment — "focus timer" variant
Overview
Running · Started June 5 · ends Aug 3 · 50/50 traffic split · Targeted at "focus timer" searches
Original page · install rate
3.1%
Of every 100 people who saw the original page in search, ~3 installed. 624 impressions → 19 installs
Of every 100 people who saw the variant, ~5 installed — +52% vs original. 626 impressions → 29 installs
All charts
What this variant changes
Left = what users currently see on your product page. Right = what users entering from "focus timer" search would see instead.
Original page
Subtitle / tagline
A simple timer for deep work
First screenshot
Generic timer UI (uploaded 18 mo ago)
Short description (first line)
Pomodoro timer with simple controls and minimal distractions.
→
Variant (for "focus timer" entries)
Subtitle / tagline
The focus timer for deep work
First screenshot
Desktop with active focus-session overlay (new)
Short description (first line)
A focus timer for deep work. Block distractions, track sessions, build a daily habit.
Variant performance by entry path (which search brought the user to your page)
This experiment is targeted at "focus timer" searchers only. Users entering from other paths continue to see the original page — so the variant doesn't risk hurting traffic from your healthy keywords.
Entry path
Impressions
Original CR
Variant CR
Change
Status
"focus timer" search
626
3.1%
4.7%
+52%
Receiving variant
"pomodoro" search
8,420
3.7%
—
—
Original served
"study timer" search
2,640
4.3%
—
—
Original served
Direct link / browse
1,840
4.1%
—
—
Original served
Only "focus timer" searchers see the variant. The 52% improvement comes from those users alone. Traffic from your other keywords continues to land on the original page, so the experiment can't hurt them.
Variant performance by country
Country
Variant impressions
Original CR
Variant CR
Change
United States
412
3.4%
5.1%
+50%
United Kingdom
98
2.8%
4.4%
+57%
Canada
71
3.0%
3.9%
+30%
Australia
45
2.9%
4.2%
+45%
Run a new experiment from a tracked keyword
Pulled from your Ranking & Visibility watchlist. Picking one creates a new keyword-targeted variant, pre-scoped to that search term's traffic only.
Tracked keyword
Why it's worth experimenting
Your rank
Action
deep work
Term not in your subtitle · click-through rate half the peer median
#22
productivity timer
Partial title match · 8 page views, 0 installs in last 30 days
#28
tomato timer
High-converting discovered term (0.61% impr→install) · not yet tagged